Google Analytics displays the origin of your visitors and this is most frequently used and valued feature of it. Traffic acquisition reports are used to make decisions about future marketing campaigns.
Despite the fact that Google Analytics GA4 can display this information, a few interface elements may be more difficult to understand than in Universal Analytics.
Because of that, I choose to write a blog post that will guide you about using these reports in GA4.
The importance of acquisition reports
Here are some suggestions if someone is unsure what accomplishments an individual can make with these acquisition reports.
Find the top performers:
If you own an online business, the sources that provide the top sales or revenue and email subscribers will be the top performer.
You may try to find out where the users are coming from and then extend that achievement to another marketing medium.
Find the weak points:
You can concentrate on the points where your marketing strategies are failing through this report and utilize the comparison feature for the worst and best performers. It might make it easier to spot problems that need to be rectified.
For instance, you can determine the traffic sources which receive more than 10,000 monthly visits yet have low conversion rates.
Traffic sources with high traffic but low engagement rates are another case of a weak spot, it may be a sign that the landing website or page did not live up to the expectations of the visitors.
Evaluate your targeted campaigns:
This report will also indicate the performance of marketing campaigns and add specific parameters to marketing campaigns by using UTM parameters.
The results are shown in these acquisition reports after GA4 gathers the information. For instance, which advertising strategy/ campaign brought the bulk of leads or visits for the company?
Acquisition Report Overview
Reports are found by selecting Reports > Acquisition. There are three choices by default which include overview, user, and traffic acquisition.

Overview shows the traffic to your website. It is a dashboard that displays site users and conversion rates and several links are available there that open more detailed reports.

Additional cards will appear in the overview of your GA4 property connected to Google Ads.
User Acquisition shows how many visitors visit the website, whereas Traffic Acquisition displays new and returning visitors.
How to Navigate Acquisition reports?
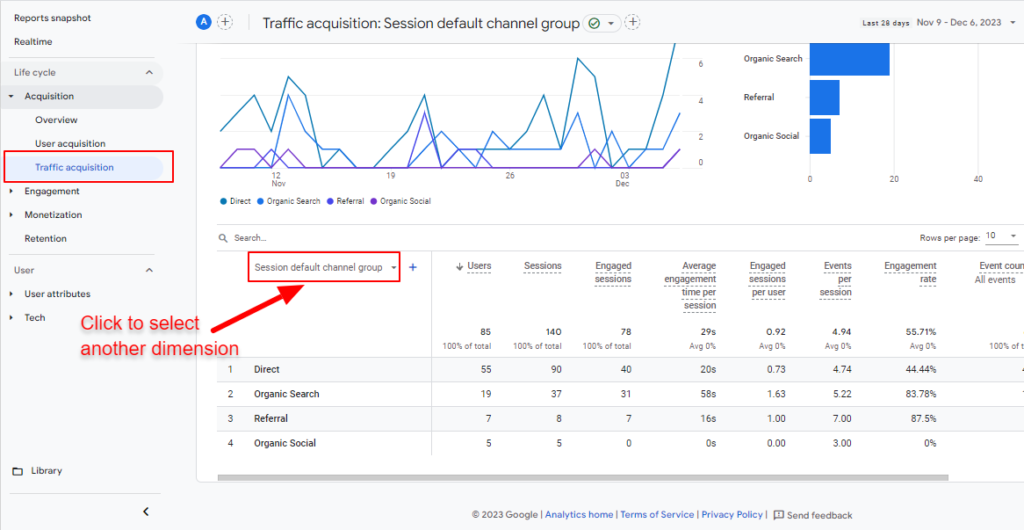
Click on Traffic acquisition. A primary dimension can be modified and look for more detailed information.
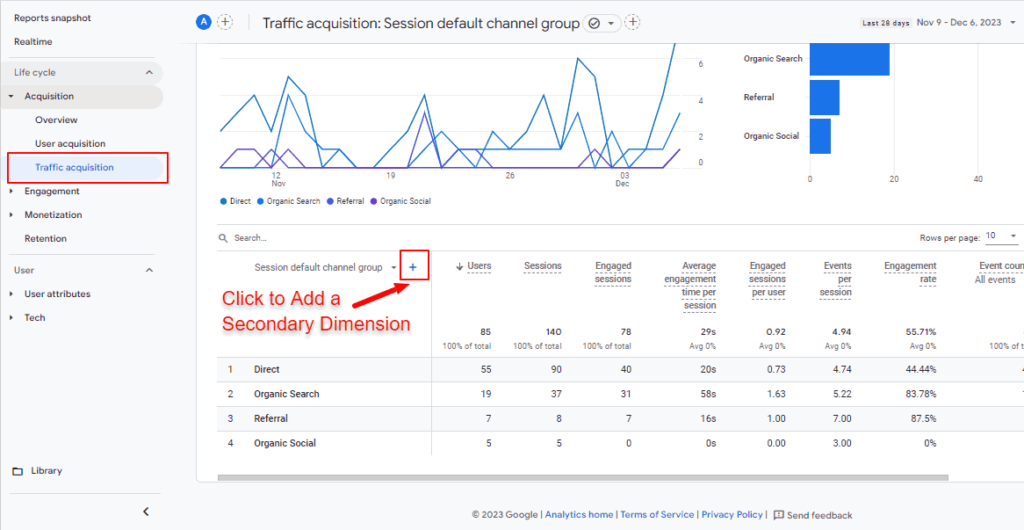
You can also click the Plus icon to add the secondary dimension, which allows you to see more information.
For instance, Traffic Acquisition reports show the top-performing campaigns. Let us assume that the top performer here refers to who “brings out the enormous conversions”.
Choose “Session campaign” from a primary dimension’s drop-down table.

To view how well each campaign performed and generate conversions, scroll horizontally now. You can choose a specific conversion event title for more precision.

You can modify the report if any metric is not helpful.
Click on Session source/medium before selecting the Plus symbol if you desire to look at the source/medium as well as the campaign together, click on Session campaign from the menu.
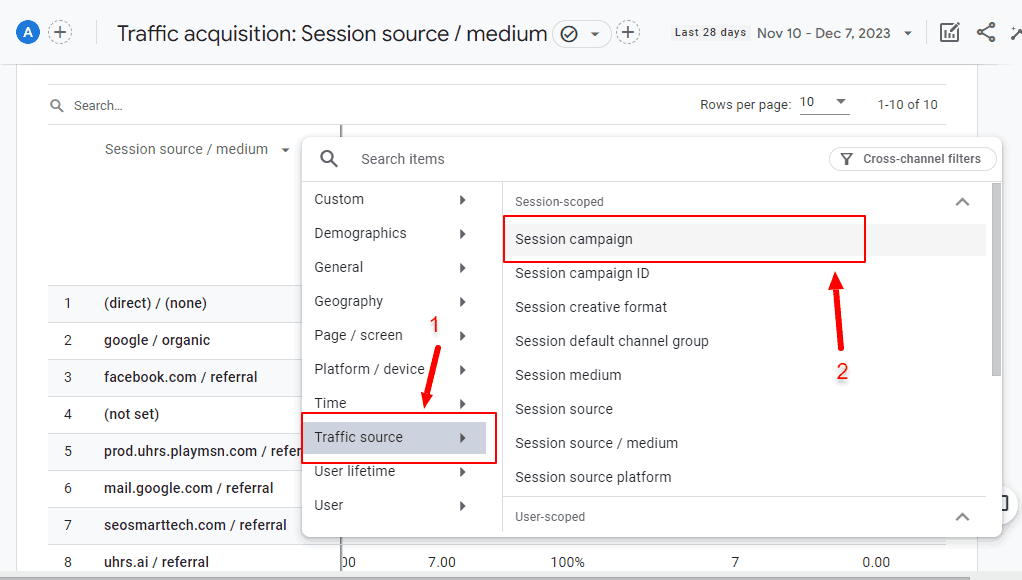
And that is it! You can see all campaigns along with their performance now.

At the top of a report table, there is a search function that you can use. It searches for matches or similar data in the top two columns.
Here is an example of how to view all the referral campaigns, I simply typed email into the search field while Session source/medium encounter as the primary and session campaign as the secondary dimension. All rows containing the word “referral” were matched by this.

Default channel grouping
These are the rule-based classification of traffic sources and it identifies the right source. It has to do with the way Google classifies different sources of traffic into bigger groups. For instance, Google-recognized search engines’ traffic is included in organic search.
Unassigned will be shown if you own any traffic sources which is not included in any groupings.
The difference among User & Traffic Acquisition reports
The first source that sent a visitor to a website is the main topic of the user acquisition report. The recent or latest traffic source which brings the visitor landed to a website is the main emphasis of the traffic acquisition report.
User acquisition employs first-click, and the traffic acquisition report utilizes last-click attribution if you are known to attribution modeling.
Because of this, you will see that User acquisition dimensions begin with the First user, whereas Traffic acquisition starts with a session when you look at the dimension names in those reports.

Let us illustrate the differences between User and Traffic acquisition reports. Think about the visitor who visits the website via Google Search, signed up for the newsletter, and returned the following day via email campaign.
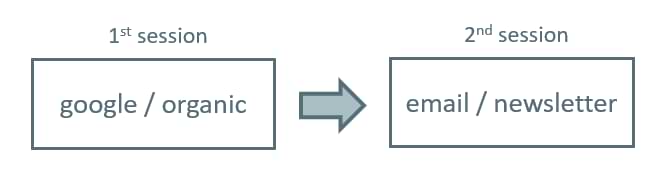
There are 2 sessions of similar users in total and the reports will present various information.
- User acquisition will feature each session to the Google (As Google was the foremost source or medium used by the user)
- According to Session Acquisition, the first session will be credited to Google, whereas the second session to Email (As Traffic acquisition is concerned with the source of traffic of every session independently).
The traffic acquisition report is a similar thing in GA4 if an individual is seeking a substitute for the Universal Analytics Source report.
Do not utilize Source, Medium, and Campaign
There are three different types of traffic source dimensions in Google Analytics 4 which includes
- The one with the prefix “First user”
- And the one that starts with “Session”
- The other ones, such as Session, Medium, and Campaign, etc.
If you have previously used GA3, this may be puzzling, and if you wish to see the sources, media, or any campaigns of “session” then you must utilize dimensions that begin with the term Sessions.

Use of Source, Medium, Session, Campaign, or any other dimensions is not recommended.
Event scope is used in it, which is crucial to employ dimensions that begin with those words since you are seeking user-scoped and session-scoped dimensions.
Customizing the traffic acquisition reports
I don’t like the acquisition reports default settings. The default dimensions in charts are not frequently used, and a few metrics are either missing or not there. If we wish to customize the acquisition report. In the top-right area tap on the Pencil icon after opening it.
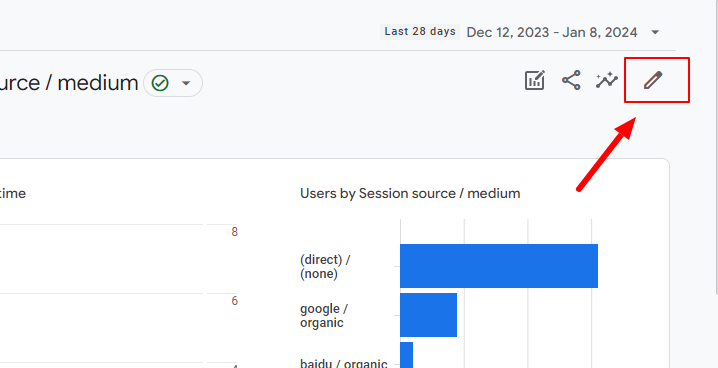
If the icon is not present, you don’t have permission to access that GA4 attribute.
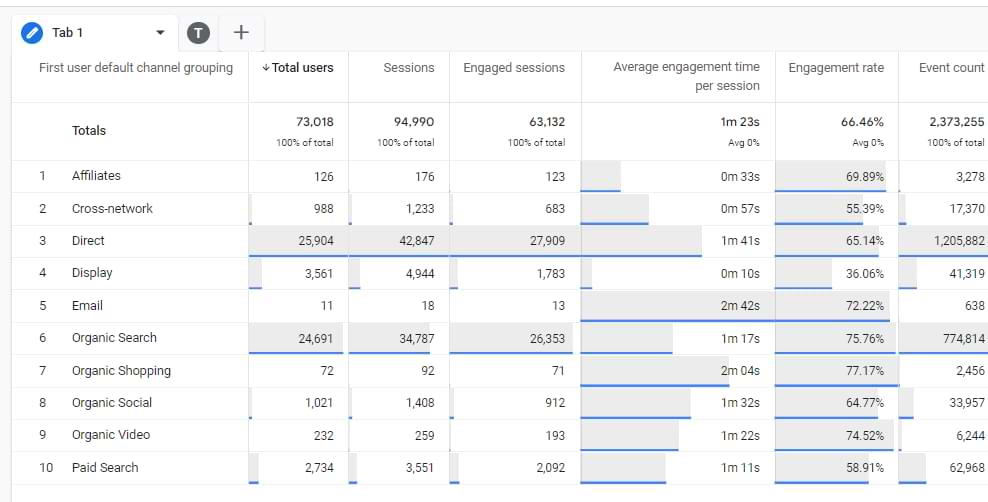
There will be a sidebar towards the right. Select Dimensions. A session default channel group is preferable. I’ll suggest clicking the three dots adjacent to the dimension to set it as the default.

By selecting Add Dimension, you can add session-scoped dimensions. Examples include Session term (also known as utm_term) and Session ad content (also known as utm_content). Click Apply once you have chosen the dimensions.
Following up “The numbers”.
On the same right sidebar click Metrics to add or remove specific metrics.
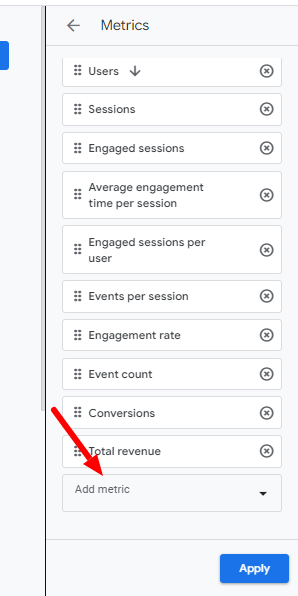
Click X in front of any metrics you do not find useful. Click Add metric if you wish to add more there are several options available here. E-commerce purchases, for example, may be helpful if you wish to know how frequently visitors purchases from your website and to alter the sequence of metric or dimensions, drag them down with the icon.

Click Apply if you are satisfied with your changes.
I frequently disable bar charts since I do not find them functional. We can also improvise a line chart (for example, if we want to know about the total sessions instead of the top five sources)
In the future, GA4 might fix this, but who knows?
Select the “Eye icon” right next to a specific chart if you want to hide it.
Once you have done all required customizations, you can publish all these modifications now.
The current report can be saved by selecting Save > Save changes.
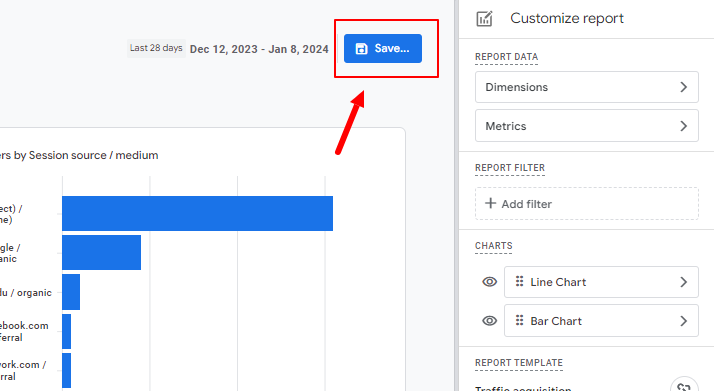
Next, tap on Save, you are done. The report is customized now.
Conversion rates included in traffic acquisition reports are another customization idea.
Additional tips
Let me give you some tips as a dessert that might be helpful.
Zoom out
The fact that the tables are too broad or wide and do not fit on most screens is one of the problems I have with the GA4 interface. A horizontal scroll shows up.
There are a lot of important metrics towards the right(such as Conversions and Revenue), and I can arrange them, but perhaps other metrics are beneficial too, and I want to see all of them at once. If the screen is too small, think about zooming out.
However, It is a piece of valuable advice to zoom out (for example, by pressing CTRL & – ) and Check if that improves the report.
By clicking here, the standard reports sidebar can be concealed and put out of sight.

It will free up some room.
Replicate acquisition report in the explorations
Would you prefer to work with explorations? It will take many clicks to replicate the traffic acquisition report, which is tedious, and exploration allows access to analytical techniques and data that are not present in the report. It has a secret feature i.e. with a single click you can replicate the report in the explorations.
Click the Edit comparisons icon while you are using a User Acquisition or Traffic acquisition report.
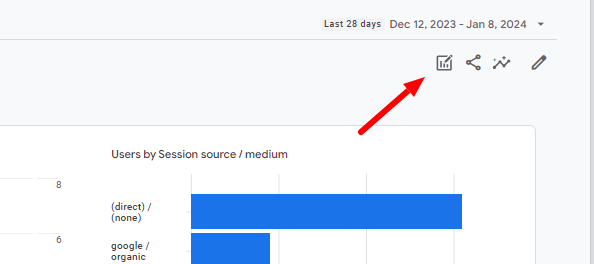
There will be a sidebar at the right and click on Explore.

Voilà!
By exploration, that same report is replicated.
Try to eliminate irrelevant metrics, hide the sidebars, or zoom out the report if the displayed table is broad or wide and will not fix on the majority of screens.
Google Analytics 4 Acquisition reports: Final thoughts
You have enough information on how to utilize these reports or locate the information that is required.
The interface could use some customizations, and traffic acquisition reports can be easily customized with comparisons and used to know the strengths and weaknesses of marketing strategies and campaigns.
You get used to it once it is more comfortable for you to navigate the interface in the future.
I would suggest the following customizations:
- If required, switch the primary dimension to the session or source of the first user.
- Add Conversion rate or session metrics.
- Remove any unused charts because they clog up the view.
Read Our Latest Guides on GA4: